

Once your bots are emitting alerts…
Where do these alerts go, and how are they used?
Today’s meditation is about the full lifecycle of a Forta alert , from agent to endpoint to response.
Forta’s Alert Flow
Let’s walk through the end-to-end journey of an alert:
1. Your Forta Agent detects suspicious activity
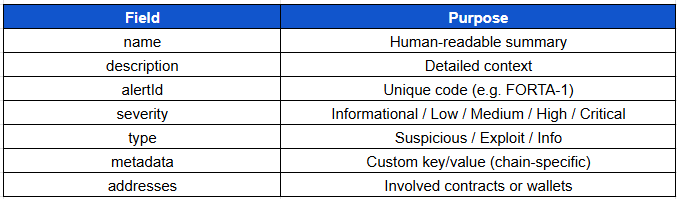
Your agent calls alert(), outputting:
alert.namealert.descriptionalert.severityalert.metadataalert.addresses
Example:
{
  "name": "High ETH Transfer",
  "description": "More than 1,000 ETH sent",
  "severity": "High",
  "metadata": {
    "amount": "1200 ETH",
    "from": "0xabc...",
    "to": "0xdef..."
  }
}
2. Scan Node pushes the alert
Scan nodes submit alerts to the Forta network. This includes:
Agent ID
Bot metadata
Timestamp
Chain ID
3. Forta Explorer displays the alert
The alert becomes publicly visible at:
explorer.forta.network/alerts
You can filter alerts by:
Bot
Chain
Address
Time
Label
This helps analysts review and prioritize activity.
4. Alerts are sent via webhooks
You can configure your bot to deliver alerts to:
Discord (via webhook)
Slack (with custom formatter)
PagerDuty (critical alerts)
SIEM or Grafana (JSON endpoint)
his is the point where monitoring translates into actionable operations
5. Alerts trigger response
Depending on your organization:
An on-call engineer might investigate
A dashboard might auto-flag a protocol for review
A response playbook might be initiated (e.g. pause governance)
The power of Forta isn’t just in detecting threats, but in completing the response cycle.
Alert Structure: What to Include
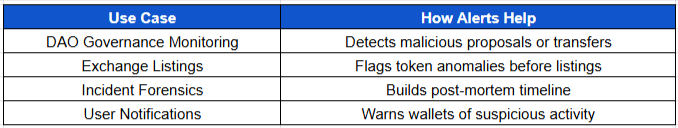
Real-Life Uses of Alerts
Key Concepts Recap
Forta alerts move from your bot to scan nodes > explorer > endpoint
Alerts are structured JSON messages with metadata and severity
Routing alerts to the right system enables real-world response
You control what’s visible, where it goes, and how it’s handled
Next lesson we will set up routing integrations for Slack, Discord, and PagerDuty.
🙏 Until next meditation,
The Blockchain Security Monk